
The workforce is important—so much so that the United States citizens seem to drop everything when the weekly jobless claims are reported each Thursday.
The gurus constantly ask questions like:
Did the US job numbers go down?
What is the trend of US unemployment?
What is the labor force participation rate?
How will the stock market react to this data?
All market movements seem to hinge on American workforce numbers.
Work Force Statistics - What We’re Covering
When economists are forecasting the future growth of the economy, it’s obvious that they consider worker statistics—but what do they look at specifically?
Labor force participation rate.
Unemployment rates.
Labor numbers by gender, age, and race.
Labor force participation by state and even by country.
Want the low-down on all of these?
Perfect. We found over sixty stats on them.
(Some are what you’ll expect, while others are quite shocking.)
Enjoy the U.S. workforce statistics below (and some interesting global workforce statistics)—
US Statistics—Total Workforce
What do the work statistics for the US look like?
The average hourly earnings for all employees is $33.03 (Trading Economics, 2023)
The median household income in the US in 2021 was $70,784 per year. This is a 38.7% increase from the median income of $51,017 in 2010, which outpaces inflation by 7% over that same stretch of time. (Statista)
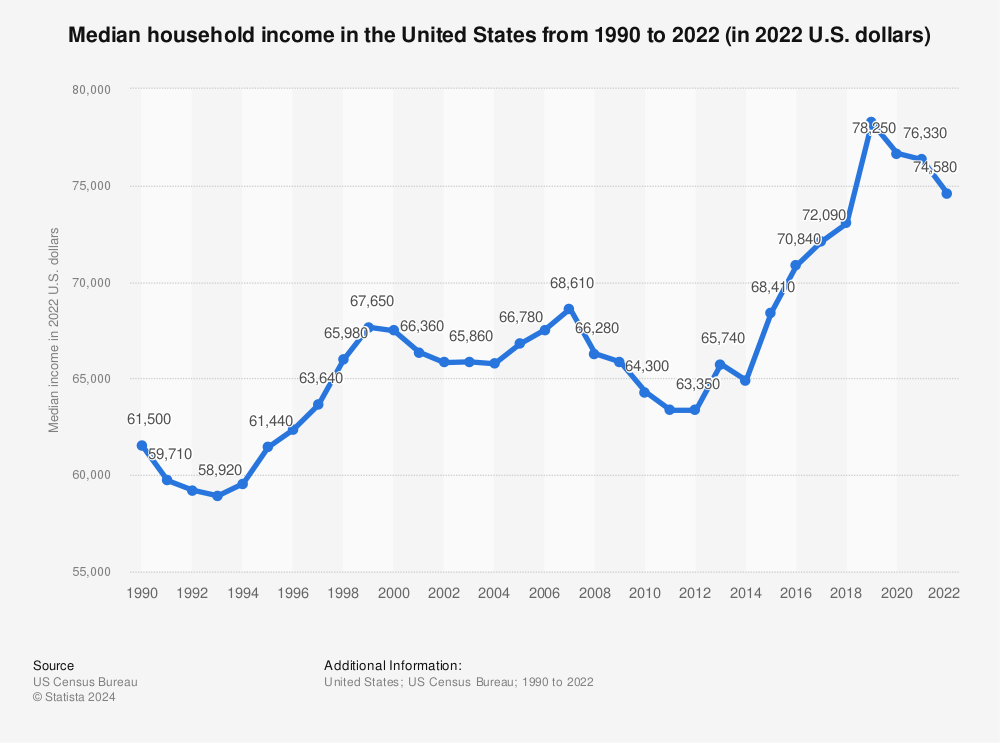
Find more statistics at Statista.
In December 2022, the total US civilian labor force was 165 million people (Bureau of Labor Statistics)
Since 2012, the US workforce numbers have increased by 6%, which matches the general population growth over that span. (Bureau of Labor Statistics, Macrotrends)
US CIVILIAN LABOR FORCE TREND | ||
|---|---|---|
Year | Total | % Growth |
2012 | 155,628 | |
2013 | 155,182 | -0.29% |
2014 | 156,332 | 0.74% |
2015 | 158,035 | 1.09% |
2016 | 159,678 | 1.04% |
2017 | 160,535 | 0.54% |
2018 | 163,206 | 1.66% |
2019 | 164,704 | 0.92% |
2020 | 160,757 | -2.40% |
2021 | 162,410 | 1.03% |
2022 | 164,966 | 1.57% |
Labor Force Participation Rate (LFPR)
Who’s included in the labor force by the Bureau of Labor Statistics’ Current Population Survey (CPS)?
The labor force includes people aged 16 and older who supply labor to produce goods or services—and people that are employed, and unemployed but looking for work.
Students, family workers, and unpaid workers are often excluded from the statistics.
What is the labor force participation rate?
The labor force participation rate is simply the ratio of people in the labor force (both those working or actively looking for work) vs. the civilian noninstitutional population (all those old enough to work).
The total civilian labor force is 165 million people. The entire civilian noninstitutional population is 264.8 million. So the labor force participation rate in the United States is 62.3%. (Bureau of Labor Statistics, 2022)
How to calculate labor force participation rate
The labor force participation rate formula looks like this:
(Labor Force ÷ Civilian Noninstitutional Population) x 100
Labor participation rate by year
Back in the 1950s, the labor force participation rate was 59%. Labor force participation peaked in 2000 at over 67%. It has been slowly decreasing ever since and is now at 62.3%. (Trading Economics)
Over the last decade, the US labor force participation rate has remained relatively constant at roughly 63%. (Bureau of Labor Statistics)
US WORKFORCE PARTICIPATION RATE BY YEAR | |
|---|---|
Year | % |
2012 | 63.7 |
2013 | 62.9 |
2014 | 62.8 |
2015 | 62.7 |
2016 | 62.7 |
2017 | 62.7 |
2018 | 63 |
2019 | 63.3 |
2020 | 61.5 |
2021 | 62 |
2022 | 62.3 |
The forecasted labor force participation rate is projected to rise over 63% again in 2024. (Trading Economics)
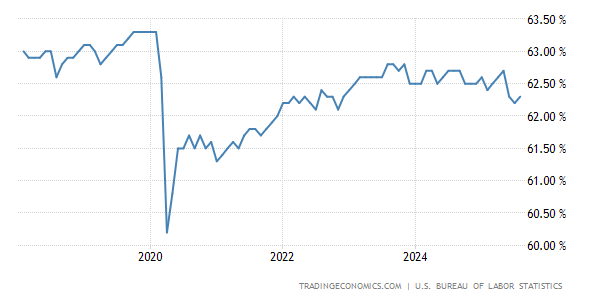
Source: Trading Economics
Unemployment Rate Trends
The unemployment rate was 3.5% in December 2022—which is consistent with 2022 as a whole. (Statista)
There are 5.2 million unemployed people in the United States (December 2022, Bureau of Labor Statistics)
Unemployment rates in 2012 were 7.9% and trended (on average) down through 2022, where rates were just 3.5%. (Bureau of Labor Statistics)
% US UNEMPLOYMENT RATES | |
|---|---|
Year | Total US |
2012 | 7.9 |
2013 | 6.7 |
2014 | 5.6 |
2015 | 5 |
2016 | 4.7 |
2017 | 4.1 |
2018 | 3.9 |
2019 | 3.6 |
2020 | 6.7 |
2021 | 3.9 |
2022 | 3.5 |
Related: Homelessness Statistics: How Many People Are Homeless in America in 2023?
Target unemployment rate
Investopedia says,
“Many [economists] consider a 4% to 5% unemployment rate to be full employment and not particularly concerning.”
If we had a 0% unemployment rate and everyone had full employment, there wouldn’t be room for growth in the economy—and the labor market would be inflexible.
The natural movement of labor is why true full employment can’t happen—and why many economists believe a 4% or 5% rate is a healthy unemployment number to target.
Unemployment rate chart
What does it look like if we graph the US unemployment rate over the last two or three decades?
The peak unemployment over the last 25 years was nearly 10% in 2010. It steadily reduced through 2020 and went below 4% for the first time in 50 years. Then Covid hit, and the unemployment rate skyrocketed to over 15%, but it quickly fell below 4%. (Trading Economics)
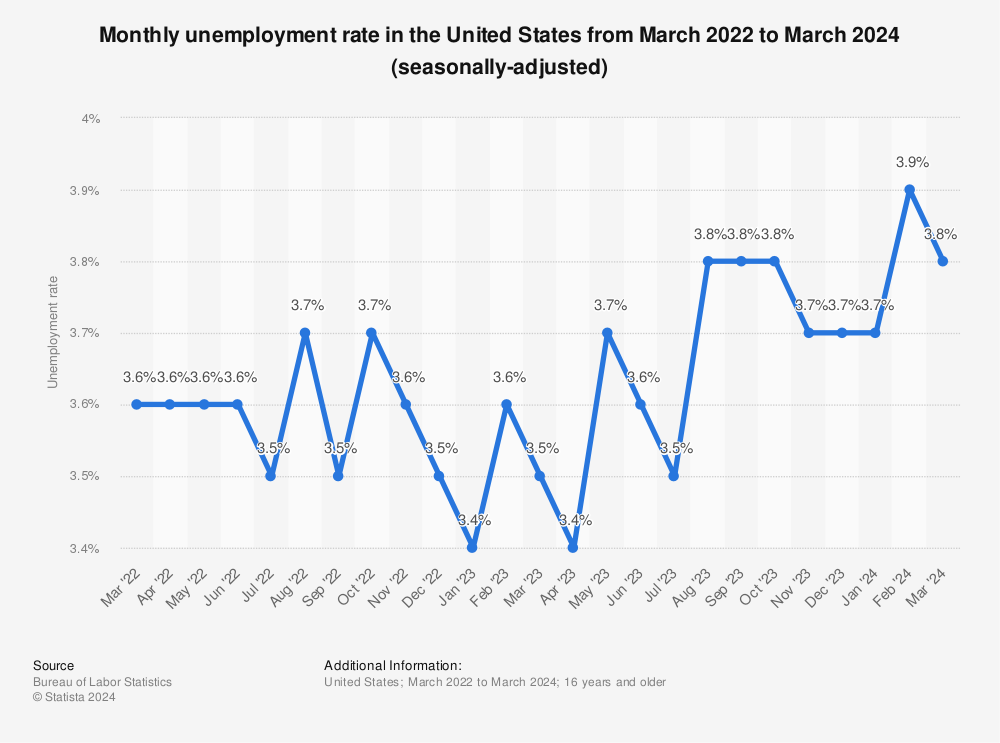
Find more statistics at Statista.
Trading Economics forecasts the unemployment rate to rise over 5% in 2024.
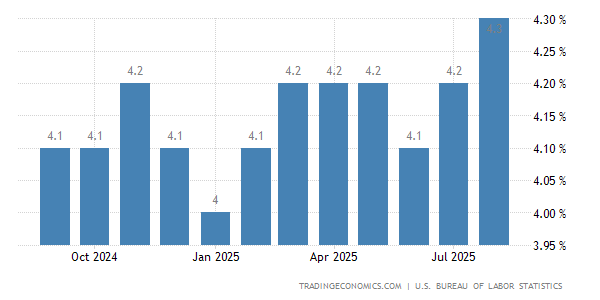
Source: Trading Economics
Labor Force Participation Rate by State
Which states have the largest percentage of people in the workforce? (And who has the least?)
These numbers may surprise you—
The states with the lowest labor force participation are Mississippi (54.6%) and West Virginia (54.8%). (Federal Reserve Economic Data)
The states with the highest labor force participation are the District of Columbia (71.7%), Nebraska (69.8%), and Colorado (69%). (Federal Reserve Economic Data)
STATE | LABOR FORCE PARTICIPATION RATE % (2022) |
|---|---|
Alabama | 57 |
Alaska | 65.3 |
Arizona | 61.2 |
Arkansas | 56.5 |
California | 62.1 |
Colorado | 69 |
Connecticut | 64.2 |
Delaware | 60.2 |
District Of Columbia | 71.7 |
Florida | 59.5 |
Georgia | 61.5 |
Hawaii | 60.4 |
Idaho | 62.4 |
Illinois | 64.3 |
Indiana | 63.2 |
Iowa | 67.6 |
Kansas | 66.1 |
Kentucky | 57.6 |
Louisiana | 58.5 |
Maine | 57.9 |
Maryland | 65.3 |
Massachusetts | 65.1 |
Michigan | 59.9 |
Minnesota | 67.9 |
Mississippi | 54.6 |
Missouri | 62.6 |
Montana | 62.3 |
Nebraska | 69.8 |
Nevada | 61.2 |
New Hampshire | 65.9 |
New Jersey | 63.6 |
New Mexico | 55.7 |
New York | 60.5 |
North Carolina | 60.3 |
North Dakota | 68.6 |
Ohio | 61.2 |
Oklahoma | 60.5 |
Oregon | 62.9 |
Pennsylvania | 61.7 |
Rhode Island | 63.5 |
South Carolina | 56.3 |
South Dakota | 68.3 |
Tennessee | 59.2 |
Texas | 63.5 |
Utah | 68.1 |
Vermont | 61.8 |
Virginia | 63.7 |
Washington | 64.4 |
West Virginia | 54.8 |
Wisconsin | 64.7 |
Wyoming | 63.1 |
Labor Force Participation Rate by Country
Here’s where the stats get even more interesting—
In some countries, nearly every individual works. In others, it could be less than half.
The country with the highest labor force participation rate is Slovakia, at 94%. Business Culture says this is because of high unemployment levels and minimal unemployment benefits. (Trading Economics)
Other notable countries with high labor force participation are Angola (89.8%), Switzerland (83%), Malta (79.9%), Germany (79.8%), and Iceland (79.8%). (Trading Economics, 2022)
COUNTRY | LABOR FORCE PARTICIPATION RATE (%) |
|---|---|
Slovakia | 94.00% |
Angola | 89.80% |
Switzerland | 83.00% |
Malta | 79.90% |
Germany | 79.80% |
Iceland | 79.80% |
United Kingdom | 78.50% |
Bolivia | 77.72% |
Netherlands | 75.50% |
Euro Area | 74.90% |
European Union | 74.80% |
Estonia | 73.70% |
France | 73.70% |
Albania | 73.40% |
Kuwait | 73.36% |
Sweden | 73.10% |
Norway | 72.40% |
Denmark | 71.70% |
New Zealand | 71.70% |
Namibia | 71.20% |
Belgium | 71.00% |
North Korea | 70.50% |
Singapore | 70.50% |
Malaysia | 69.80% |
Indonesia | 69.06% |
Vietnam | 68.70% |
Latvia | 68.50% |
Macau | 68.50% |
Finland | 67.70% |
Philippines | 67.50% |
Romania | 67.10% |
Hungary | 66.86% |
Australia | 66.60% |
Italy | 65.70% |
Cyprus | 65.40% |
Canada | 65.00% |
Ireland | 64.70% |
Jamaica | 64.70% |
Colombia | 63.80% |
Ecuador | 63.40% |
South Korea | 63.30% |
Israel | 63.20% |
Guatemala | 63.00% |
Brazil | 62.70% |
Uruguay | 62.70% |
Lithuania | 62.50% |
Japan | 62.40% |
United States | 62.30% |
Russia | 62.20% |
Austria | 62.10% |
Dominican Republic | 62.10% |
Luxembourg | 61.80% |
Ukraine | 61.80% |
El Salvador | 61.70% |
Saudi Arabia | 61.50% |
Armenia | 60.90% |
Costa Rica | 60.50% |
Portugal | 60.20% |
Czech Republic | 60.00% |
Chile | 59.80% |
Mexico | 59.69% |
Slovenia | 59.50% |
Mongolia | 59.20% |
Taiwan | 59.17% |
Spain | 58.52% |
Hong Kong | 58.30% |
South Africa | 58.30% |
Poland | 57.90% |
Bulgaria | 57.50% |
Rwanda | 56.60% |
Serbia | 55.80% |
Macedonia | 55.22% |
Trinidad And Tobago | 55.20% |
Turkey | 54.10% |
Georgia | 53.50% |
Cape Verde | 53.00% |
Greece | 52.70% |
Croatia | 52.20% |
Sri Lanka | 49.00% |
Argentina | 47.60% |
India | 47.50% |
Palestine | 46.00% |
Puerto Rico | 45.10% |
Moldova | 42.30% |
Algeria | 42.20% |
Kosovo | 39.30% |
Jordan | 33.00% |
Employment Statistics By Race
Are you wondering about the labor force characteristics by race and ethnicity?
What’s the compilation of the United States, and how is it trending?
Of the 165 million workforce in the United States, 76.7% are White, 12.9% are Black, and 6.6% are Asian. (2022, Bureau of Labor Statistics)
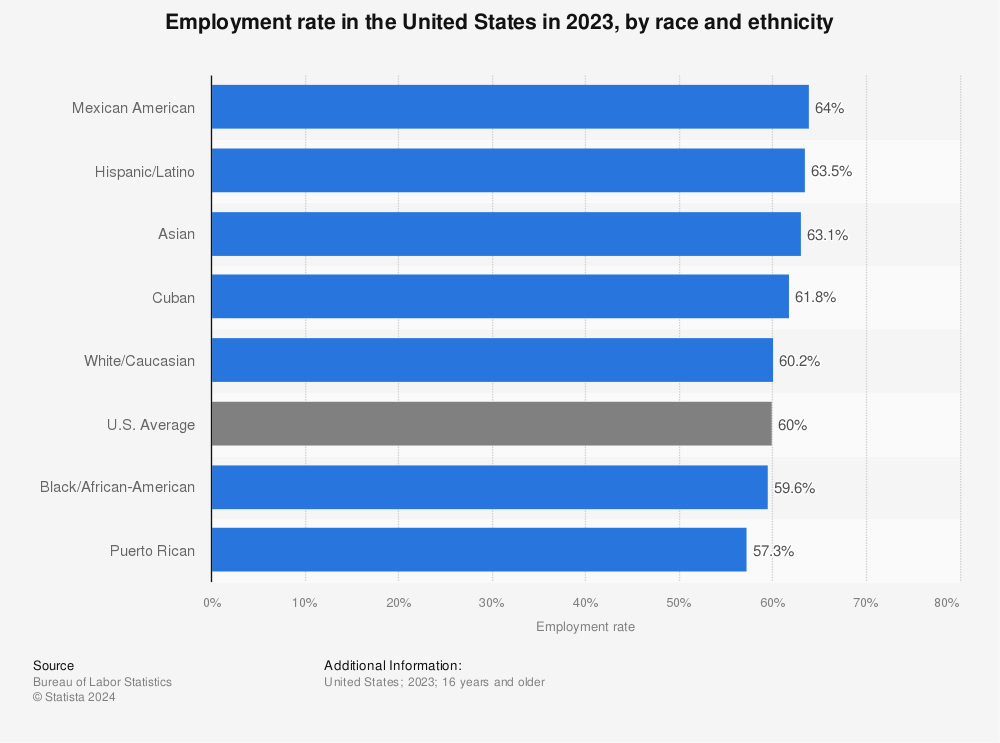
The average employment rate in the US is 58.4%. (Statista)
The following ethnicities are employed at a higher-than-average rate: Mexican Americans (61.2%), Hispanics/Latinos (61.1%), Asians (60.6%), and White/Caucasians (58.6%). (Statista)
These ethnicities had worse-than-average employment: Cuban (57.6%), Black/African-American (55.7%), and Puerto Rican (55%). (Statista)
Find more statistics at Statista
In 2012, the unemployment rates of Whites, Blacks, and Asians were 6.9%, 14%, and 6.6%, respectively. Fast-forward to 2022, and unemployment rates have come down for all races. Asians have the lowest unemployment rate at 2.4%. (Bureau of Labor Statistics)
% UNEMPLOYMENT RATE BY RACE | ||||
|---|---|---|---|---|
Year | White | Black | Asian | Total US |
2012 | 6.9 | 14 | 6.6 | 7.9 |
2013 | 5.9 | 11.9 | 4.3 | 6.7 |
2014 | 4.7 | 10.6 | 4.4 | 5.6 |
2015 | 4.4 | 8.5 | 4.1 | 5 |
2016 | 4.2 | 8 | 2.7 | 4.7 |
2017 | 3.7 | 6.7 | 2.6 | 4.1 |
2018 | 3.5 | 6.6 | 3.3 | 3.9 |
2019 | 3.2 | 6 | 2.6 | 3.6 |
2020 | 6.1 | 10 | 6 | 6.7 |
2021 | 3.3 | 7 | 3.8 | 3.9 |
2022 | 3 | 5.7 | 2.4 | 3.5 |
Male vs female employment statistics
After sifting through data and reorganizing it (so it actually made sense), we were able to break down the work stats by gender.
In this section, you’ll see labor participation rates, unemployment rates, and occupations by gender.
Women in the workforce statistics
How many women are in the workforce?
In December 2022, there were 77.1 million women in the workforce, of which 74.1 million were employed, and three million were unemployed. (Bureau of Labor Statistics)
What percentage of the workforce is female?
In the 1920s, the share of women in the workforce (vs. the total) was 20.3%. (Department of Labor)
In the 1960s, the ratio of women in the workforce was 32.2%. (Department of Labor)
With a total workforce of 165 million, this means that women make up 46.7% of the labor force. This percentage is also consistent with 2002 stats. (Bureau of Labor Statistics)
Women employment
In 2002, there were 63.6 million women employed in the workforce. By 2022, this number grew by 16.5% to 74.1 million (compared to men who showed 15.5% growth). (Bureau of Labor Statistics)
The top occupations for women are administrative support (11.6 million), business management (8.1 million), education (6.8 million), and finance (5 million). (Bureau of Labor Statistics, 2022)
While there may not be a shocking increase in the quantity of women in the workforce, the numbers are staggering when you review the growth by occupation—
In 2002, there were 1.2 million women in production and transportation. This number grew by 319% to 5 million in 2022. (Bureau of Labor Statistics)
In sales and office occupations, the presence of women has increased by 134% from 2002 to 2022, from 8 million to 18.6 million. (Bureau of Labor Statistics)
In the prestigious field of a working professional, the number of women has increased from 12 million (2002) to nearly 22 million (2022)—with most of those increases in computers, math, architecture, and engineering. (Bureau of Labor Statistics)
The earnings gap between women and men
The median hourly earnings of women aged 16 and older are only 84% that of men. (Pew Research, 2020)
For female workers between the ages of 25 and 34, the median earnings are 93% of what men earn. (Pew Research, 2020)
Women who took just one year off from work reportedly earn 39% less than women who did not. (AAUW, American Association of University Women, 2019)
Mothers are 40% more likely than fathers to report that child care issues harmed their careers. (AAUW, American Association of University Women, 2019)
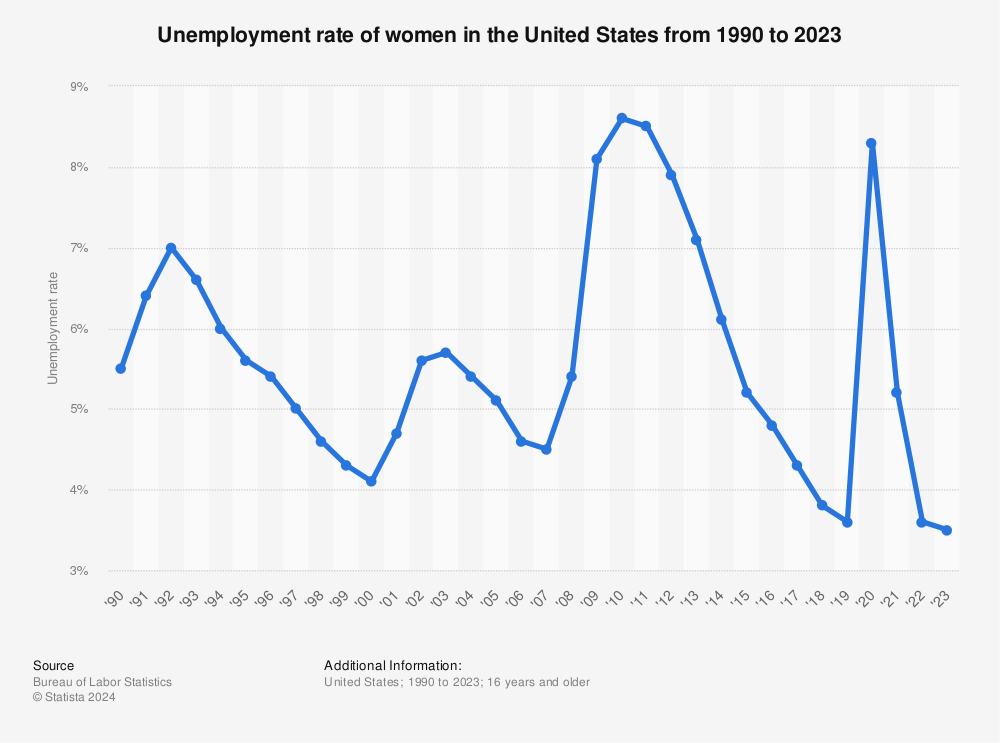
Women unemployment
The total female labor force is 77.1 million. As of December 2022, 74.4 million are employed—making the unemployment rate 3.6% for women. (Bureau of Labor Statistics)
In 1990, the female unemployment rate was 5.5%. The peak female unemployment rate was in 2010 at 8.6%. The lowest rate of unemployment was 3.6% in 2022. (Statista)
Find more statistics at Statista
Statistics on single mothers in the work force
The average US labor force participation rate is roughly 63%. For single mothers with children under 18, the rate was 77.6%. (AAUW, American Association of University Women, 2019)
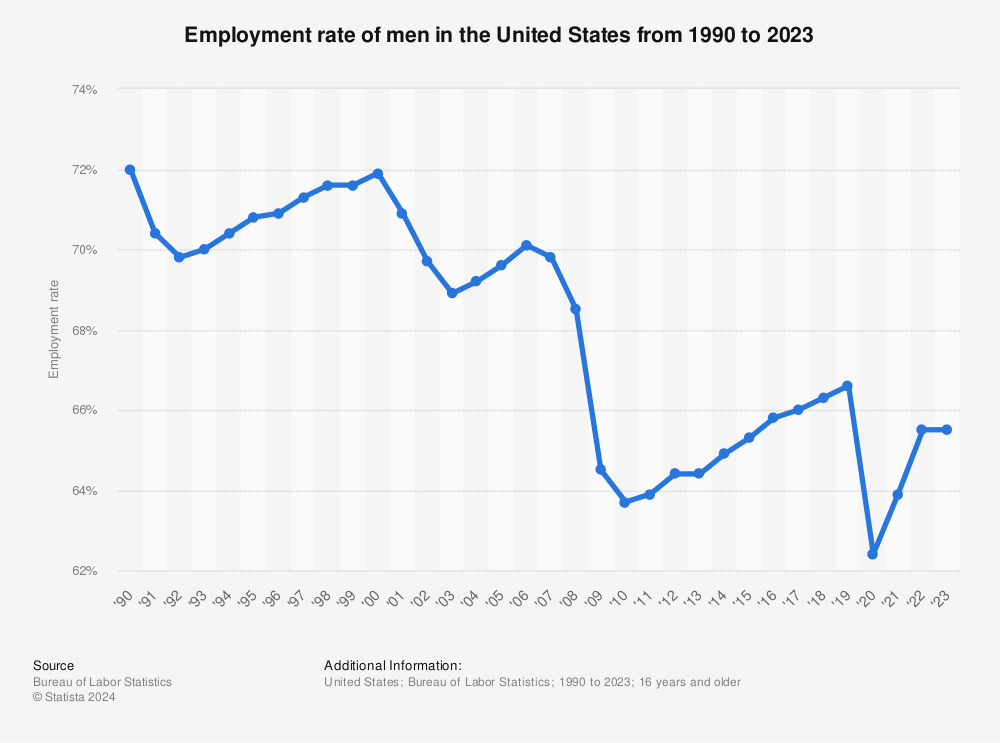
Men in the workforce US statistics
In 2022, the employment rate for men in the US was 65.5%. This rate has been falling steadily since the late 1990s when it was 71.9%. (Statista)
Find more statistics at Statista
The total US male labor force is 87.9 million. Employed men total 84.9 million, meaning the unemployment rate for males is 3.4%. (Dec 2022, Bureau of Labor Statistics)
In 2002, there were 72.9 million men employed in the US workforce. The growth from 2002 to 2022 is approximately 16%, which is consistent with the population growth. (Bureau of Labor Statistics)
The top occupations for men are business management (12 million), transportation (9.2 million), construction (8.1 million), and sales (7.2 million). (Bureau of Labor Statistics, 2022)
The only major occupational category where men grew at a faster rate than women (from 2002 to 2022) was in the service industry (healthcare support, food preparation and serving, personal care). Male participation in this field increased by 46%. Women’s labor numbers grew by just 25.9%. (Bureau of Labor Statistics)
Labor force participation by age
For those that are 16-19 years old and aren’t attending school, the labor force participation rate is 37.2% (much lower than the national average of about 62%). (Federal Reserve Economic Data, 2023)
The labor participation rate is highest among 25 to 34-year-olds at 83.3%. The participation slowly declines from 35 to 54 years old and then drops sharply for those over 55. (Bureau of Labor Statistics)
AGE GROUP (YEARS) | LABOR PARTICIPATION RATE, JAN 2023 |
|---|---|
16 to 19 | 37.2% |
20 to 24 | 71.5% |
25 to 34 | 83.3% |
35 to 44 | 83.2% |
45 to 54 | 81.4% |
55 and over | 38.7% |
Labor participation rates have been on the rise for those 55 years and older (from 2000 to 2023). Labor rates for 65 to 69-year-olds have increased 44% since 2000. (Advisor Perspectives)
The labor rates for ages 75 and over have increased by 60% since 2000. More surprisingly, though, the labor rates for women aged 75 and over have increased by 94%, whereas men of the same age have increased by just 38.8%. (Advisor Perspectives)
In 2017, millennials became the largest generation in the US labor force (36% of the labor force). (Pew Research)
Labor force age range
Those that are 16 years of age or older (and not going to school full-time) are considered in most labor statistics data.
Unemployment rate by age
When looking into the unemployment rate by age, I expected a bit of a bell curve—high unemployment for young people, low unemployment for the middle-aged, and a high unemployment rate for older people.
This assumption was incorrect.
The unemployment problem lies purely within the young adult age group.
The unemployment rate for 16 to 19-year-olds is 10.9% (Federal Reserve Economic Data, 2023)
The unemployment rate for ages 20 to 24 is 7.8% (Federal Reserve Economic Data, 2023)
For ages 25 and over, the unemployment rate is 3.1%. (Federal Reserve Economic Data, 2023)
AGE GROUP (YEARS) | UNEMPLOYMENT RATE |
|---|---|
16 to 19 | 10.9% |
20 to 24 | 7.8% |
25 to 34 | 4.4% |
35 to 44 | 2.9% |
45 to 54 | 2.6% |
55 to 64 | 2.4% |
65 and older | 3.0% |
United States labor force by occupation (industry)
US employment by sector
What are the top job fields today?
Are they the same occupations that have existed for decades, and will they continue to dominate the labor market in the future?
Let’s dig in—
Most US jobs are in the “professional” industry, which employs 38.7 million people. This industry has seen growth of over 76% since 2002. (Bureau of Labor Statistics, 2022)
The most common “professional” jobs are healthcare practitioners (9.8 million), education (9.2 million), and computer and mathematical occupations (6.2 million). (Bureau of Labor Statistics, 2022)
Other top industries include sales and office (30.4 million), management occupations (management, business, and finance; 29.3 million), and service (food preparation, building and grounds, healthcare support; 25.4 million). (Bureau of Labor Statistics, 2022)
In the 1940s, jobs in manufacturing far outweighed any other industry with 16 million jobs vs. the next highest sector in retail, with 3.5 million jobs. By 2021, manufacturing dropped to the fifth spot. Education and health services is now on top, followed by professional and business services, retail, and leisure and hospitality. (Statista, 2021)
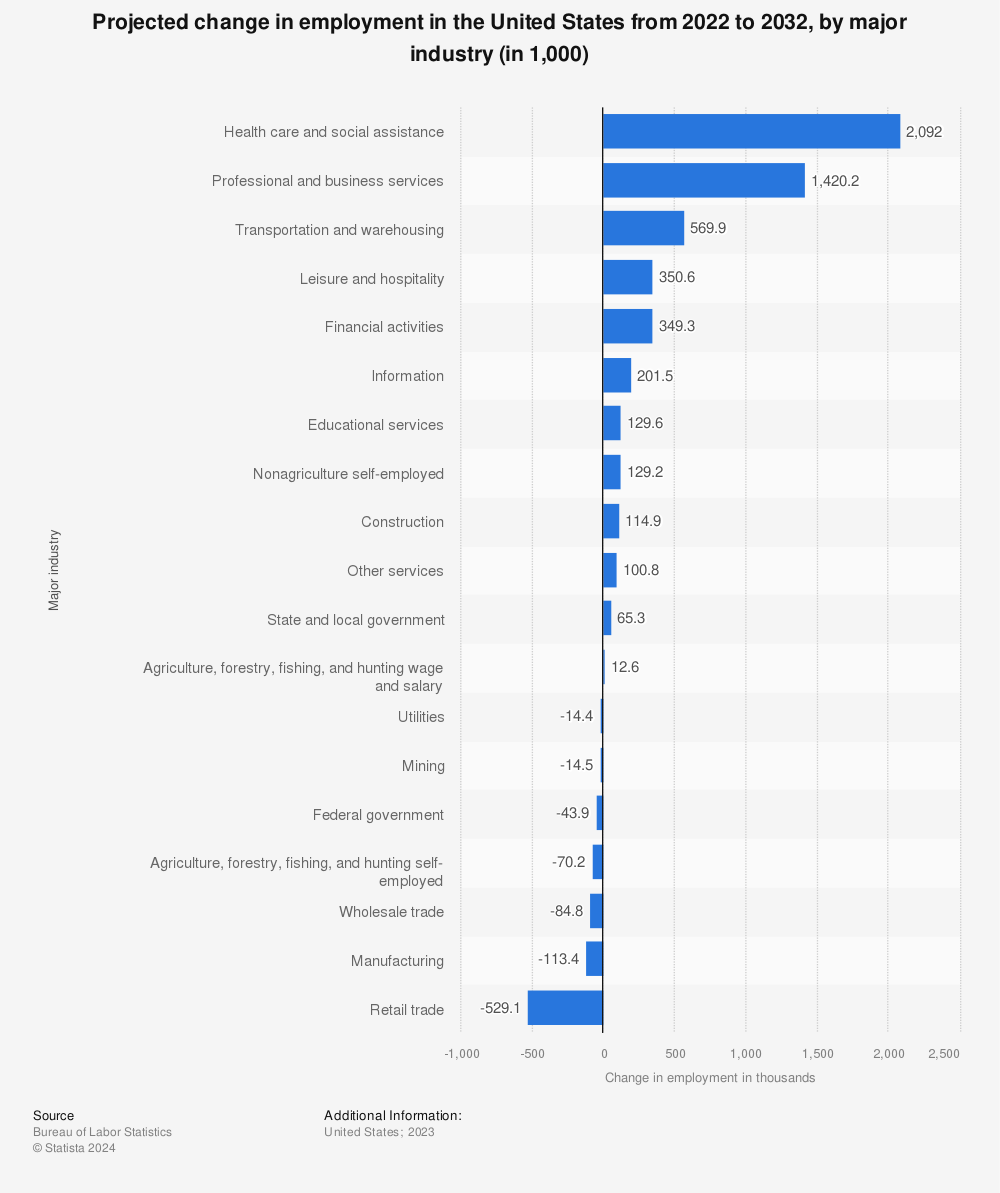
Sectors with the highest growth potential (from 2020 to 2030) are health care (+3.3 million jobs), leisure and hospitality (+3.2 million jobs), and construction (+3.1 million jobs). (Statista)
Sectors with an expected decline in future jobs (from 2020 to 2030) are non-agricultural self-employment (-730,000 jobs), retail (-587,000 jobs), utilities (-390,000 jobs), the federal government (-68,000 jobs), and agricultural self-employment (-23,000 jobs). (Statista)
Find more statistics at Statista
US production vs. service industry employment
Many believe the majority of Americans hold service occupation jobs.
Is this true?
Based on the January 2023 non-farm payroll data provided by the Bureau of Labor Statistics—
Over 71% of Americans work in the service industry. The top fields include business services, trade and transportation, education and health services, and leisure and hospitality.
Roughly 29% of Americans work in a goods-producing industry, such as manufacturing, construction, and non-durable goods.
Underemployment in the US
The Federal Reserve Bank of New York defines underemployment as “working in a job that typically does not require a bachelor’s degree.”
How many individuals are underemployed in the US?
Underemployment rates spiked with the Covid-19 pandemic. Since then, underemployment rates have returned to decade lows at 2.8%. (Cleveland Fed, 2021)
The underemployment rate of college graduates is much higher. In September 2022, nearly 40% of recent college graduates were underemployed in the US.
Related: 100+ Job Satisfaction Statistics in 2023
Underemployment rate charts
Work Statistics—Key Findings
The most important employment statistics in the US are the labor force participation rates and unemployment rates.
These are the standout statistics and trends that we’ve discovered in our research:
The US labor force participation rate is 62.3%, which has been fairly static over the last decade.
The US unemployment rate in December 2022 was 3.5%, which is historically low. This rate is expected to climb to 4% or 5% by 2024.
Finding work at a young age (without being underemployed) is difficult, but the labor participation and unemployment rates improve dramatically at 25 years of age.
Many older people (those over 75 years of age) are returning to work for more income (most of which are women).
Women continue to earn less than men—they earn roughly 93 cents for every dollar a man makes. And mothers are 40% more likely than fathers to report that child care issues harmed their careers.